

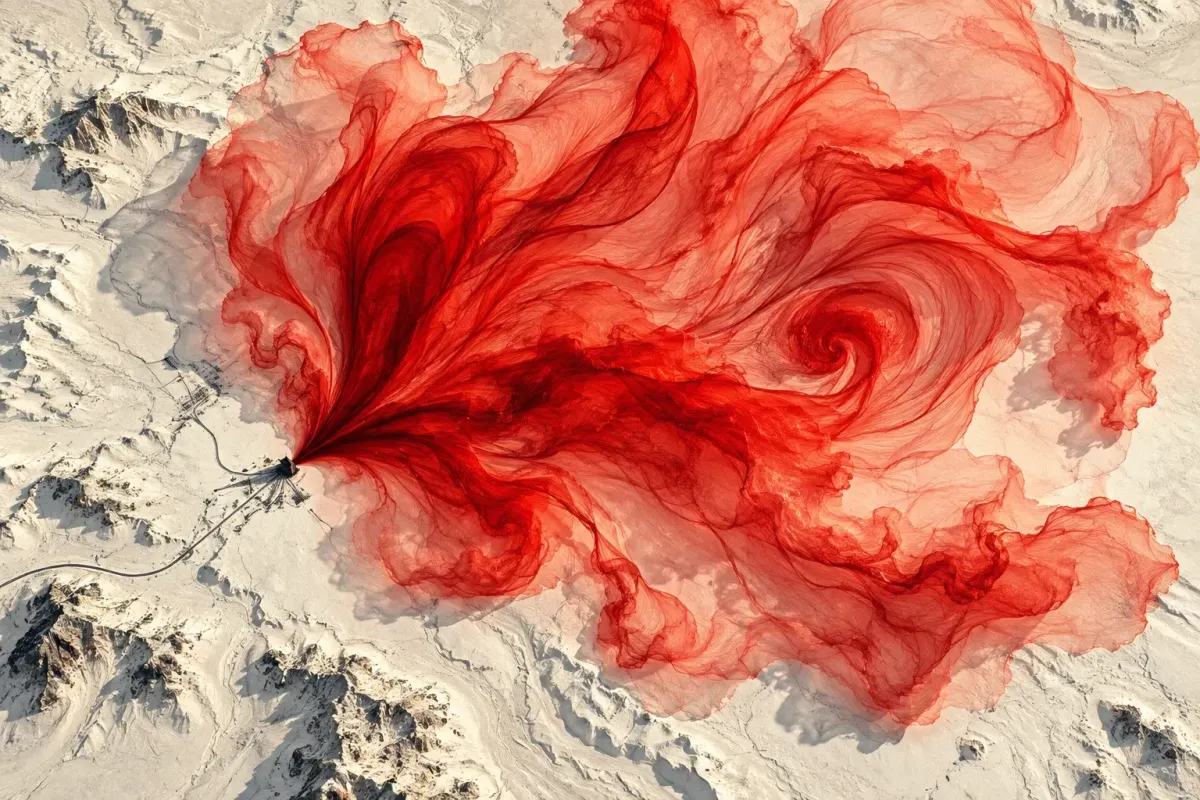
Imagine a satellite map with a bright plume trailing away from an industrial site. The picture feels like an accusation: here is the source, and here is the damage. But before sharing it, look for the observation date, the confidence label and the units. Those small details determine what the image can actually tell you.
On September 1, 2026, Google Research presented MAPL-EMIT, an AI framework for finding methane plumes in observations from NASA’s EMIT instrument. The release points to a PNAS paper, public data and research code. Its promise is practical: process large collections of satellite measurements and identify places that deserve investigation.
The confidence labels are especially revealing. They turn a technology announcement into a more interesting question: how should someone act on a detection?
The gas was already visible to the instrument
EMIT is an imaging spectrometer on the International Space Station, originally developed to study surface minerals. Methane absorbs infrared light in a characteristic pattern, allowing the instrument to detect gas that an ordinary photograph cannot show. NASA had already reported methane detections in October 2022. MAPL-EMIT builds on that capability.
The difficult part is interpretation. A landscape contributes its own complicated signal. Google describes a model that considers both the spectrum and the surrounding spatial pattern, helping distinguish a spreading plume from a patch of ground with a confusing signature. It was trained using 3.6 million simulated plumes inserted into real EMIT scenes.
That is a useful combination: physics supplies examples of how gas might disperse; machine learning learns patterns in the resulting measurements. The simulations remain training material, not millions of observed leaks.
The July 29 revision of the researchers’ preprint abstract reports detection of 84% of expert-annotated NASA plume complexes across 1,084 EMIT granules, alongside roughly 1.5 times as many plausible plumes as the human comparison collection. These are research-team results. The 84% measures recovery of that reference set; it is not an overall accuracy score or proof that every additional candidate is real.
One label changes the next step
The public plume catalog separates detections into two confidence categories:
| Catalog label | Basis described by the provider | Provider-reported false-positive rate |
|---|---|---|
| High | Detection on at least three separate EMIT observations over time | Approximately 3–5%, from human review of a random subset |
| Medium | No temporal match across multiple observations | Approximately 50–55%, based on human review |
These estimates describe the provider’s validation; Vastkind has not independently reproduced it. They are also category-level findings, not a calibrated probability attached to every location.
Our interpretation: medium-confidence markers warrant follow-up, not accusations against a named operator.
Repeated detection also rewards observation history. A short-lived event may matter environmentally even if it never receives a high-confidence label.
Read the measurement before reading the color
The companion enhancement dataset reports estimated methane enhancement in ppm-m: an excess above background integrated along the atmospheric column. It also provides a separate pixel-level plume score.
An enhancement map describes gas inferred to be present along the measurement path. An emission rate asks a different question: how much is being released per unit of time? Deriving that rate requires additional modeling and wind information. The enhancement documentation explicitly describes combining its outputs with winds for this purpose.
This is why a brighter patch is not a ready-made emissions bill. Comparing sites responsibly requires a consistent estimation method and its uncertainties, not just the colors chosen for a map.
Coverage needs similar care. NASA’s instrument documentation describes observations of sunlit regions between approximately 52° north and 52° south. The AI does not create measurements where the instrument collected none. The enhancement catalog also warns that clouds, shadows and dark surfaces degrade performance.
A blank area can therefore mean several things. It cannot, by itself, certify a clean site.
As checked on September 7, the plume catalog’s listed observation range ends on June 9, 2026. The September announcement should not be mistaken for a live account of what facilities are emitting today.
The valuable next story happens on the ground
There is something worth using here. Researchers can inspect candidate locations, compare observations and examine the released methods. Google’s public code repository includes inference, plume extraction and vetting workflows. Its README also says this is not an officially supported Google product. We inspected that documentation; we did not run the model.
For Vastkind, the compelling follow-up would connect a detection to a documented response: additional measurements, a confirmed source, an intervention and evidence of the change afterward. That chain would show how an analytical capability becomes an environmental result.
It is the same distinction we explore in our dossier on when breakthroughs become useful. Better detection can make the next decision possible. The decision, the repair and the measured reduction still need their own evidence.
