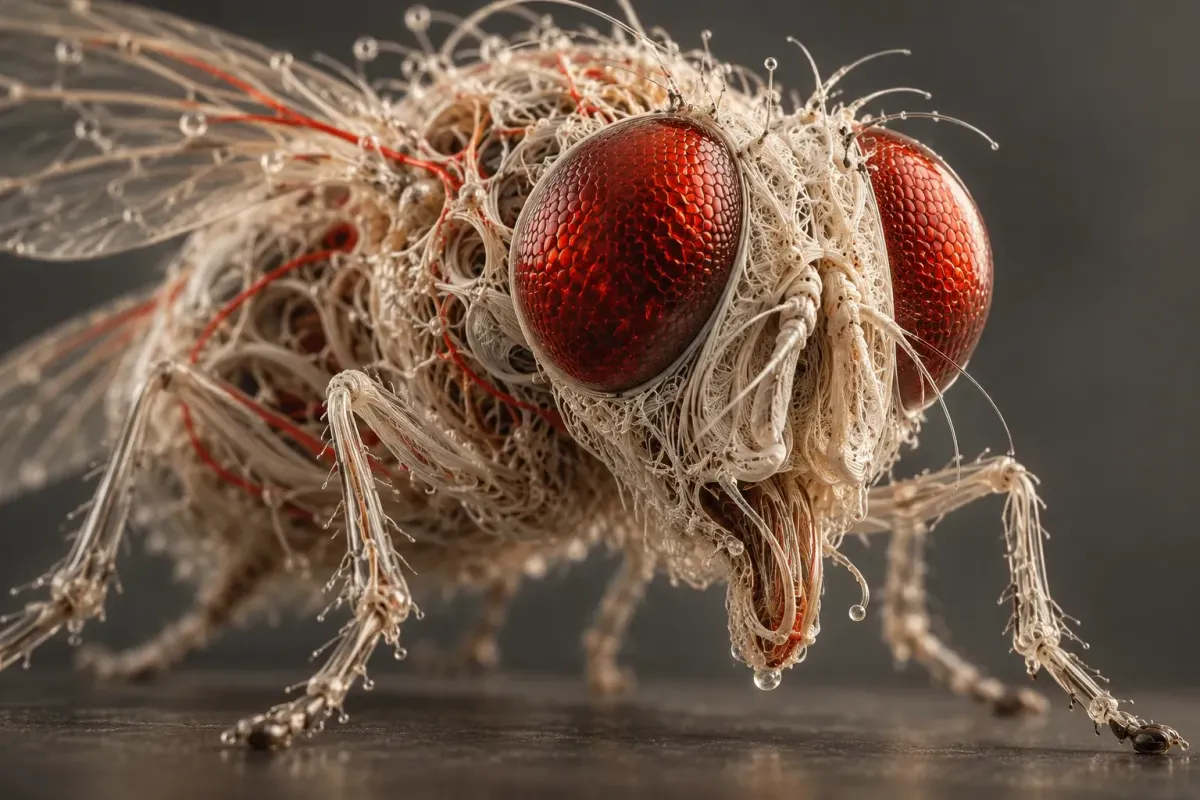
The most revealing feature of a new fruit fly wiring map might be its neck.
A brain can detect something interesting. Getting six legs to move toward it requires a connection to the machinery below. The male fruit fly connectome preserves that connection: the brain and ventral nerve cord belong to the same specimen, joined through an intact neck. Researchers can investigate a sensory pathway without reaching the edge of one map and having to switch to another animal.
The resource contains roughly 166,700 neurons and more than 100 million synaptic connections. Its scale is impressive. The more interesting question is what someone can now do with it.
Follow the route through the neck
Janelia’s explanation and pathway visualization include a concrete example: a reconstructed visual pathway running from the R1–R6 photoreceptor neurons toward DNg13, a neuron involved in descending control. The visualization identifies a route through the nervous system; it does not record what happened inside a freely behaving fly.
That distinction makes the example more useful. A researcher investigating a turn can ask which cells sit between visual input and the circuits controlling movement, where other inputs arrive, and which connection might be worth disrupting experimentally. The map helps turn an enormous question—how does seeing become action?—into smaller questions about identifiable cells.
The ventral nerve cord matters because movement involves circuitry beyond the brain. A drawing ending at the neck leaves a consequential handoff unfinished. Keeping the central nervous system together gives researchers a continuous anatomical starting point.
What actually happened this September
Google Research described the work on September 3, 2026, alongside publication of the main study in Cell. Google contributed reconstruction technology; the collaboration also involved HHMI Janelia, the MRC Laboratory of Molecular Biology, Cambridge and other researchers. AI helped reconstruct neuronal shapes from microscopy images, while expert teams proofread and annotated the map.
But the resource has a longer public history. Its project timeline dates the initial release to October 2025, version 1.0 to June 8, 2026, and the journal publication to September 3.
Those are three different milestones. The September paper is the current news event; scientists did not suddenly receive their first opportunity to explore the data this week.
That chronology also explains why a dramatic new visualization can accompany research that has already been circulating. The publication date, dataset version and first public announcement answer different questions.
Small differences, widely connected
Comparisons with the previously mapped female brain reveal another reason to care about the whole network.
According to Janelia’s project overview, sex-specific and sexually dimorphic neurons comprise about 4.8% of the male central brain: cells present in one sex, or present in both with differences. These cells were concentrated in higher-order regions associated with behavioural control. Their connections extended the reach of those differences beyond the small group itself.
This is a finding about organization. Counting unusual cells alone can understate their importance if many other cells connect to them. The relevant unit is sometimes a network of relationships rather than a particular neuron in isolation.
It would be a mistake to turn that comparison into a universal explanation of male and female behaviour. The reconstructed male system comes from one animal. More specimens and functional experiments are needed to disentangle individual variation, sex-associated organization and what particular circuits actually do.
The files tell you what the map contains
The most useful antidote to an overblown brain-mapping headline is the project’s download page.
It offers neuron annotations, skeletons, synaptic locations and tables describing connectivity. Neurotransmitter information is explicitly provided as predictions. These are different kinds of evidence: a reconstructed shape, a detected connection and a predicted chemical identity should not quietly become interchangeable.
Researchers can explore the resource through neuPrint or work with downloadable files. The documentation describes account and token requirements for programmatic access; a public dataset does not mean every interface works without setup.
The list also makes a limitation tangible. Anatomical connectivity does not itself give you a continuous recording of neural activity, a fly’s changing internal state or the effect of its surroundings. To predict behaviour, a model needs additional measurements and assumptions. Its predictions then need experiments.
A sharper next experiment
Here is the practical sequence the map enables: identify a plausible route, choose a cell or connection within it, then test what changes when that part of the system is measured or perturbed. A convincing result would connect structure to activity and behaviour under stated conditions.
That is a substantial advance. It narrows where to look and makes competing explanations more specific.
It also connects with a question running through Vastkind’s first dossier: what turns a technical achievement into something useful? Here, the answer is the next experiment that becomes possible—or becomes easier to design—because the wiring is available.