
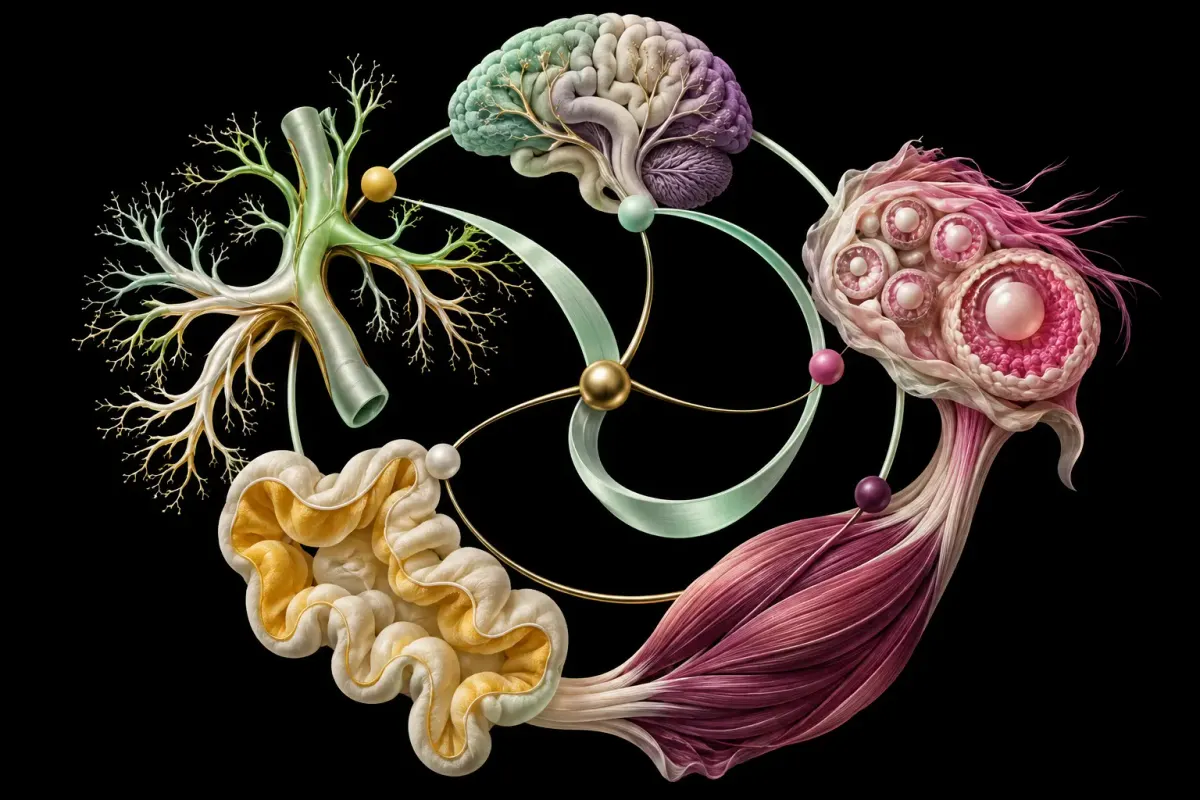
Your arteries, digestive tract and reproductive tissues do not appear to remodel on one shared timetable. A new analysis of 25,306 tissue slides found early structural acceleration in blood vessels, later change around menopause and two waves of change in several digestive and male reproductive tissues. The work turns microscopic architecture into population-level trajectories across adulthood.
The peer-reviewed analysis in Nature Aging is ambitious, but it is not a personal biological-age test. It used post-mortem samples from different people, not repeated biopsies from the same person over decades. Its “structural aging” score includes deterioration, adaptation and neutral variation that the model cannot yet reliably distinguish.
Aging has a shape, not just a molecular signature
Most aging clocks begin with molecules: patterns in DNA methylation, proteins or gene activity that correlate with chronological age or health outcomes. PathStAR—short for Pathology-based Structural Aging Rate—looks instead at how cells, extracellular material and blood vessels are arranged in ordinary stained tissue sections.
The team used the Genotype-Tissue Expression project: 25,306 slides from 40 tissue types in 970 donors aged 21 to 70. The cohort was 66.4% male. A pathology foundation model converted roughly 30.3 million image patches into numerical descriptions. Those 1,024-dimensional patch features were averaged into one representation for each slide.
The system does not look at a tissue slide and announce an age. It compares the overall visual pattern in one ten-year age group with the next, then asks where the pattern changes fastest. That produces a map of population transitions. It cannot tell an individual how old an organ “really” is from a routine scan.
For each tissue, the researchers compared adjacent ten-year windows—such as ages 21–30 with 31–40—then advanced those windows one year at a time. The magnitude of the change between windows became a structural aging rate. The approach was not trained to predict chronological age, so a nonlinear trajectory could emerge rather than being forced into a steady upward line.
The ovary was a demanding reality check
A useful method should recover a known biological pattern before its surprises are trusted. In 250 ovarian samples, PathStAR found one structural-change peak around ages 35–40 and another around 55–60. Those periods align with accelerated follicle loss and menopause. Matched gene-expression and methylation data from the same samples did not reproduce the same two peaks when analyzed with the paper’s unsupervised trajectory method.
The result does not mean histology is universally superior to molecular clocks. Molecular clocks are often built for a different task: predicting age, disease or mortality risk. PathStAR is designed to ask when the tissue’s overall structure changes most rapidly. A clock optimized for a straight age prediction can miss a bend by design.
Across the higher-confidence tissue trajectories, three broad schedules emerged. Vascular tissues changed early, with prominent acceleration in the 30s. Uterus and vagina changed later, around the early and middle 50s. Nine of 14 other examined tissues—including parts of the digestive tract, prostate, testis and tibial artery—showed two waves, broadly in the 30s and around the 50s.
Shared timing does not prove a shared cause
During accelerated periods, the authors found a recurring molecular pattern: inflammatory pathways rose while energy production, proliferation and cellular quality-control programs fell. Later waves showed weaker hormone-response signals and stronger damage-response pathways. Those are associations measured in groups. They do not show that suppressing one pathway will prevent the structural transition.
Samples from the same donor also revealed coordination. Structural-aging deviations correlated within digestive, vascular, reproductive and brain tissues. Some cross-system relationships appeared too, including an association between digestive tissues and prostate. The correlations were often modest. A shared hormonal program is a plausible interpretation, not a demonstrated causal route.
The study’s largest limitation is time itself. It reconstructs a trajectory from people of different ages, all sampled after death. Clinical history, ventilation and the interval before tissue preservation can influence morphology. The authors tested measured post-mortem artifacts and found that they explained little of the observed variation, but unmeasured confounding remains. Ten-year windows improve statistical power while blurring shorter transitions. The cohort stops at 70, so it says little about the oldest ages.
The image representation is also a black box in an important sense. Mean pooling compresses every patch into one slide-level average. It can detect that structure changed without naming the responsible feature. The paper acknowledges that some movement in the score could be adaptive remodeling or neutral difference rather than loss of function.
That makes the next test clear. PathStAR needs replication in larger, more balanced cohorts and links to outcomes that matter: organ performance, disease incidence and response to treatment. Longitudinal imaging or clinically collected biopsies could show whether a person’s structural score predicts what happens next. Until then, the study’s strongest lesson is conceptual. The body does not age like one clock running fast or slow. It is closer to a set of interacting schedules—and structure may reveal when one of them changes phase.
Keep exploring
- Semaglutide extended lifespan in mice. What did it prove? — why a longevity result depends on the organism and outcome measured.
- These cell clusters give blood a new route — an example of structure becoming function in living tissue.
- Daraxonrasib shrinks lung tumors. Can it buy more time? — how biological change differs from a patient outcome.
AI-assisted. Sources checked.